The UK POUND vs The US Dollar
15th January 2016
15th January 2016
Given the respected market analysts at Royal Bank of Scotland are suggesting we face a dire 2016, something a bit weird has been happening. For over a month I've been expecting the FTSE to reach 5744 AND for over a month, every time it has embraced the opportunity, something has intervened to stop the rot each time the drop triggered. I'm inclined to hope this means some hidden strengths but unfortunately, it is often the case a trigger level needs two or three stabs before it finally breaks. Below 5744 would be a really bad thing, implying the doomsayers at RBS perhaps have a point.
There's another aspect of market misery which is probably worth some attention. On several occasions during 2015, I'd postulated on the risks of the Pound facing parity with the Dollar. The situation has worsened since the start of 2016 and the pairing now needs a miracle of some sort as the chart shows.
To use a technical term, the relationship is stuffed. It's now in the land of lower lows, never a good signal.
There is actually something quite ironic about all this. In the week before the Scottish Referendum on independence, the pairing was gapped (manipulated) downward to reinforce the political rhetoric from what became known as Project Fear. The movement is circled on the chart and a historical trend since 2009 was broken. This, alas, was to propel the currency pair into extremely dangerous territory and was the first time I mentioned the threat of 1:1 with the US Dollar. In the months since, the relationship failed to recover from the manipulation and is now in dire straits, entirely self inflicted.
Currently, any weakness below 1.43 looks capable of driving 1.39 next with secondary, if broken, at 1.33. But longer term, parity looks like it will be hard to avoid. Another worrying detail is, despite Brent Crude and US Crude now being literally cheaper than chips, from a UK perspective this is problematic. Crude Oil is dealt with in US Dollars and while Brent has fallen, so has the UK Pound and thus, mitigates the benefit of cheaper oil. After all, it is NOT CHEAPER if you have to find more dollars to actually pay for it!
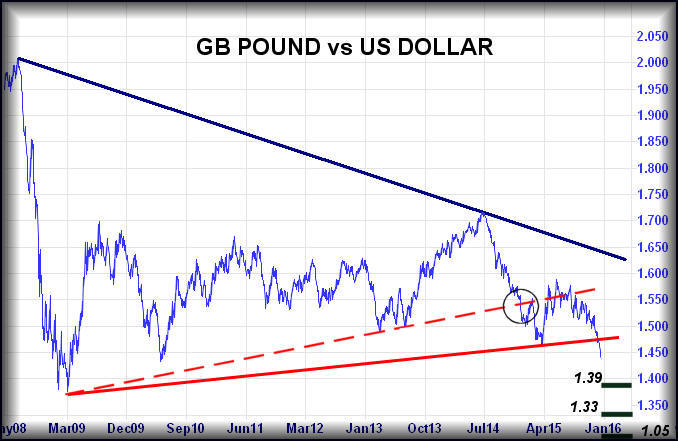
Finally, having perhaps foolishly focussed on the Doom and Gloom element, there's an important detail worth of consideration. The RED line on the chart, currently at 1.475, is all this pairing needs better to greatly reduce the chances of the above horror story coming true. When I see a price enact an emergency clamber above a long term uptrend, invariably it's a pretty strong signal the market actually does not want a price to collapse.
I can hope!
Alistair
Alistair Strang is founder of www.trendsandtargets.com